
SPSS Output Explained: Cronbach Alpha, ANOVA, Chi-Square
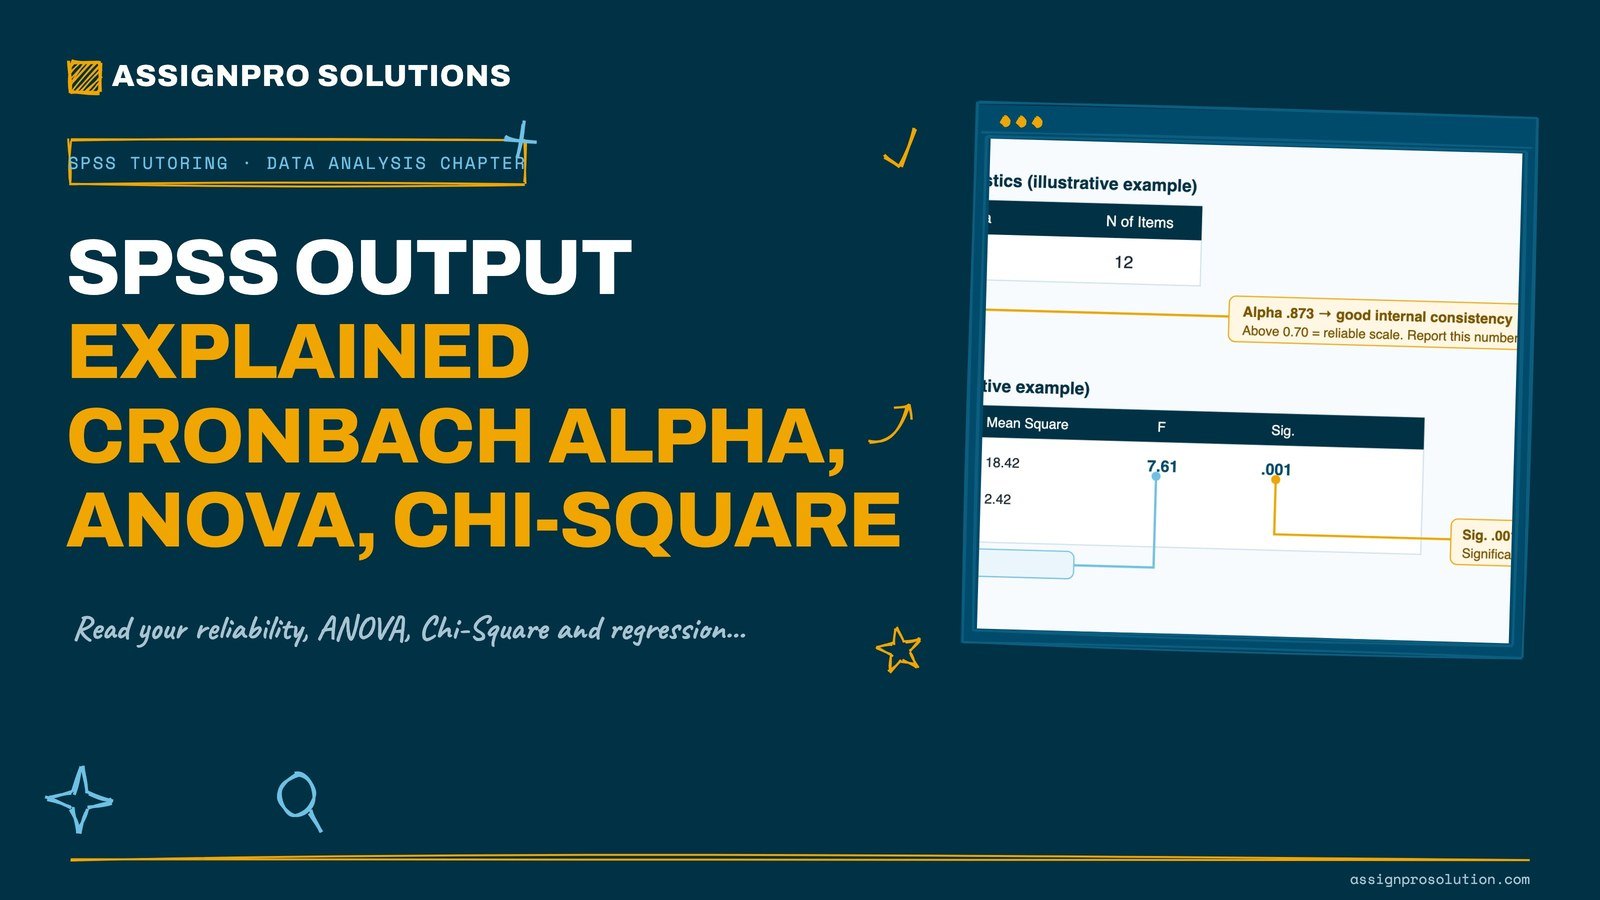
Read your reliability, ANOVA, Chi-Square and regression tables in plain English, then copy the exact sentence structure into your findings chapter.
A correct cronbach alpha interpretation reads one number: the Cronbach's Alpha coefficient in the Reliability Statistics box. Values of 0.70 or above show your scale is internally consistent and can be trusted, roughly 0.80 to 0.90 is good, and below 0.60 is weak. For every other SPSS table the logic is the same: find the test statistic (Alpha, F or Chi-Square), then read the Sig. (p) value. If Sig. is below 0.05 the result is statistically significant. This guide walks each output box in order and gives you the ready sentence to write underneath it.
It is the night before submission, SPSS has printed a wall of tables, and you are not sure which numbers matter. This guide fixes that. A confident cronbach alpha interpretation is where most students start, because the reliability table is usually the first output for any questionnaire study, so we open there and then move through ANOVA, Chi-Square and a regression note. For each figure we tell you what to look at, what it means, and the precise line to type into your data analysis chapter.
The single habit that turns a good cronbach alpha interpretation into a strong one is pairing the coefficient with a plain reading of what it tells your marker: that the items in your scale measure the same underlying idea. That same read-then-report habit carries through likert scale analysis spss work, chi square test interpretation spss tables, and your anova interpretation spss results. If you would rather have a tutor sit with you and check your own output line by line, our research paper tutoring does exactly that, on your data, without touching your submission for you.
Everything below uses an illustrative example table, not a real dataset, so you can see where each number sits. Swap in your own figures as you read. For the wider chapter structure around these results, pair this with our guides on writing a research methodology and choosing between qualitative and quantitative dissertation designs.
Figure 1: Illustrative SPSS output. Read the Alpha coefficient in the Reliability box, then read F and Sig. in the ANOVA box. Numbers shown are an example, not a real study.
1. Reliability Statistics: your Cronbach's alpha interpretation
The Reliability Statistics box appears after you run Analyze > Scale > Reliability Analysis. It holds two figures: Cronbach's Alpha and N of Items. Your whole cronbach alpha interpretation rests on the Alpha coefficient. It ranges from 0 to 1 and tells you whether the items in a scale, for example the five statements that make up your "job satisfaction" measure, hang together as one consistent construct.
Use these bands as your guide: 0.90 and above is excellent (watch for redundant items), 0.80 to 0.89 is good, 0.70 to 0.79 is acceptable, 0.60 to 0.69 is questionable, and below 0.60 is poor. Most markers want to see 0.70 or higher. If your alpha is low, the "Cronbach's Alpha if Item Deleted" column tells you which item is dragging the scale down, so you can justify removing it. This is the backbone of likert scale analysis spss, because Likert items are only meaningful when the scale they form is reliable.
"The job satisfaction scale demonstrated good internal consistency, with a Cronbach's alpha of .87 across 12 items, exceeding the accepted threshold of .70 (Field, 2018)."
Stuck on whether to drop an item or keep it? A tutor can talk you through the "if item deleted" column on your own output in one research paper tutoring session, so the decision is yours and defensible.
2. Likert scale analysis in SPSS: descriptives and reliability together
Likert data (strongly disagree to strongly agree, usually coded 1 to 5) is ordinal, so likert scale analysis spss work has two honest steps. First, describe the pattern using frequencies, the median and the mode rather than leaning only on the mean. Second, if you have combined several Likert items into a summed or averaged scale, report the Cronbach's alpha for that scale exactly as in section one. Treating a single Likert item as if it were a continuous variable is a common examiner flag, so state clearly whether you are analysing individual items or a composite scale.
"Responses to the five engagement items were positively skewed, with a median of 4 (agree). The items were combined into a single engagement scale, which showed acceptable reliability (alpha = .78)."
Choosing between describing items or building a scale is really a design question. Our guides set the context for qualitative versus quantitative approaches, and a tutoring session can confirm your coding is right before you run anything.
3. ANOVA interpretation in SPSS: are the group means different?
One-way ANOVA answers whether the mean of an outcome differs across three or more groups, for example exam scores across three teaching methods. In the ANOVA table your anova interpretation spss hinges on two columns: F (the ratio of between-group to within-group variance) and Sig. (the p value). If Sig. is below 0.05, at least one group mean differs significantly from the others. F on its own does not tell you which groups differ, so run a post-hoc test (Tukey is common) and read its pairwise comparisons to locate the difference.
| Column | What it is | What to do with it |
|---|---|---|
| F | The test statistic | Report it with degrees of freedom, e.g. F(2, 87) |
| Sig. | The p value | Below 0.05 = significant difference exists |
| Post-hoc (Tukey) | Pairwise comparisons | Tells you which specific groups differ |
"A one-way ANOVA showed a statistically significant difference in exam scores across the three teaching methods, F(2, 87) = 7.61, p = .001. Post-hoc Tukey tests indicated that Method C scored significantly higher than Method A (p = .002)."
Reporting F, the degrees of freedom and the post-hoc result together is what separates a pass from a strong grade. If your post-hoc table looks contradictory, bring it to a research paper tutoring session and we will read it with you.
4. Chi-Square test interpretation in SPSS: is there an association?
Chi-Square tests whether two categorical variables are associated, for example gender and preferred study mode. After Analyze > Descriptive Statistics > Crosstabs, your chi square test interpretation spss centres on the Chi-Square Tests box. Read the Pearson Chi-Square row: the Value column is your test statistic, df is the degrees of freedom, and "Asymptotic Significance (2-sided)" is your p value. Below 0.05 means the two variables are significantly associated. Check the footnote too: if more than 20 percent of cells have an expected count below 5, the test is unreliable and you should report Fisher's Exact Test instead.
"A Chi-Square test of independence showed a significant association between gender and preferred study mode, X squared (1, N = 200) = 6.34, p = .012."
Small samples trip up a lot of chi square test interpretation spss results because of that expected-count rule. A quick check with a tutor confirms whether Pearson or Fisher's Exact is the honest choice for your table. See how it fits your sample plan in our guides, or book research paper tutoring to walk through it.
Figure 2: The same four steps work for every SPSS test. Pick the test, read the key figure, check the Sig. value, then write one clean sentence.
Read your own SPSS output with a tutor
Bring your actual tables. We explain every figure and show you how to write it up in your own words. 100% AI-free, human-led guidance. You keep and submit your own work.
5. Regression output interpretation: a quick note
Regression asks how well one or more predictors explain an outcome. For regression output interpretation you read three boxes in order. The Model Summary gives R Square, the share of variance explained (0.35 means your predictors explain 35 percent of the variation). The ANOVA box tells you whether the model as a whole is significant (Sig. below 0.05). The Coefficients box is where the story lives: the Standardised Beta shows the strength and direction of each predictor, and its Sig. column shows whether that predictor matters. A positive Beta with a Sig. below 0.05 means the predictor significantly increases the outcome.
"The regression model was significant, F(2, 147) = 12.8, p < .001, explaining 35 percent of the variance in performance (R squared = .35). Training hours was a significant positive predictor (beta = .42, p < .001)."
Regression tables carry the most numbers, so they cause the most panic. This is the most requested topic in our research paper tutoring, and it fits naturally into the wider dissertation help we provide across your methodology and results chapters.
Putting it into your data analysis chapter
A strong data analysis chapter example follows a simple rhythm for every test: restate the hypothesis, name the test and why you chose it, present the SPSS figure, then interpret it in plain English and link it back to the question. Do not paste raw SPSS tables and leave them to speak for themselves, because a marker wants to see that you understand the numbers, not just that you produced them. Report the exact statistics (the coefficient, degrees of freedom and p value) in the wording shown in each section above, and your data analysis chapter example will read like it was written by someone in control of their results.
If you want that whole chapter reviewed, our tutors give written feedback on your own draft, aligned to your marking rubric, as part of dissertation help and focused research paper tutoring. We explain and guide. You write and submit.
Related reading
Frequently asked questions
What is a good Cronbach's alpha value?
A Cronbach's alpha of 0.70 or above is generally accepted as showing your scale is internally consistent and reliable. Roughly 0.80 to 0.90 is considered good, and above 0.90 may signal redundant items. Below 0.60 is weak, and you would usually examine the "alpha if item deleted" column to see which item to reconsider.
How do I know if my ANOVA result is significant?
Read the Sig. column in the ANOVA table. If the value is below 0.05, at least one group mean differs significantly from the others. F on its own does not tell you which groups differ, so run a post-hoc test such as Tukey and read its pairwise comparisons to locate the difference.
Which p value do I report for a Chi-Square test in SPSS?
Report the "Asymptotic Significance (2-sided)" value from the Pearson Chi-Square row. If it is below 0.05, the two categorical variables are significantly associated. Check the footnote first: if more than 20 percent of cells have an expected count below 5, use Fisher's Exact Test instead.
Can I analyse a single Likert item as a continuous variable?
A single Likert item is ordinal, so describe it with frequencies, the median and the mode rather than the mean. You may treat a scale as continuous only when several Likert items are combined into one summed or averaged measure, and you should report the Cronbach's alpha for that combined scale.
Will AssignPro write my data analysis chapter for me?
No. We are a tutoring and guidance service, so we explain how to read your SPSS output and how to phrase your findings, and we review the draft you write. You complete and submit your own work. All our guidance is 100% AI-free and plagiarism-free, human-written by subject-specialist tutors.
Need help choosing?
Send the brief on WhatsApp or email. The team will help identify the right service and tutor.